


FLOW releases density-filtered Type Curves
Use full-field assumptions to model economics, even if you aren't an engineer

FLOW just took major step forward in our industry-leading forecasting.
…And you don’t need to be an engineer to use this. In fact, you will probably get better results!
We have added a Wells Per Section density filter to our Type Curve Explorer. This is a powerful tool that helps you understand full-field development cash flow with much greater accuracy than a density-naïve approach. We accomplished this through a proprietary series of measurements around every lateral well, which we translated into a readable Wells Per Section.

Now, everyone can incorporate high-end engineering into their estimates. Without the engineer or technical experience.
Here’s what makes FLOW’s Type Curve Explorer unique and how it gets you results in a minute or two.
· Big data, machine learning, transient B-factor
· Data and pre-calculated results
· Density
· Outlier Control
· User Defined Dynamic Filtering
Example: Devon/WPX Stateline (a sub-10-minute analysis)
We have consistently alerted our subscribers to the degradation of results in WPX’s Stateline area. This issue is alive post-merger due to concerns about DVN’s Federal Lands risks.
In our prior analysis (contact us for details), we pointed out that WPX’s EURs were not increasing in a capital efficient ratio as their lateral lengths grew. Other operators were succeeding. This led us to use judgement to conclude that WPX was drilling with too much density in ultra-core Stateline.
Here we predict it in 2-3 easy steps without that judgement.
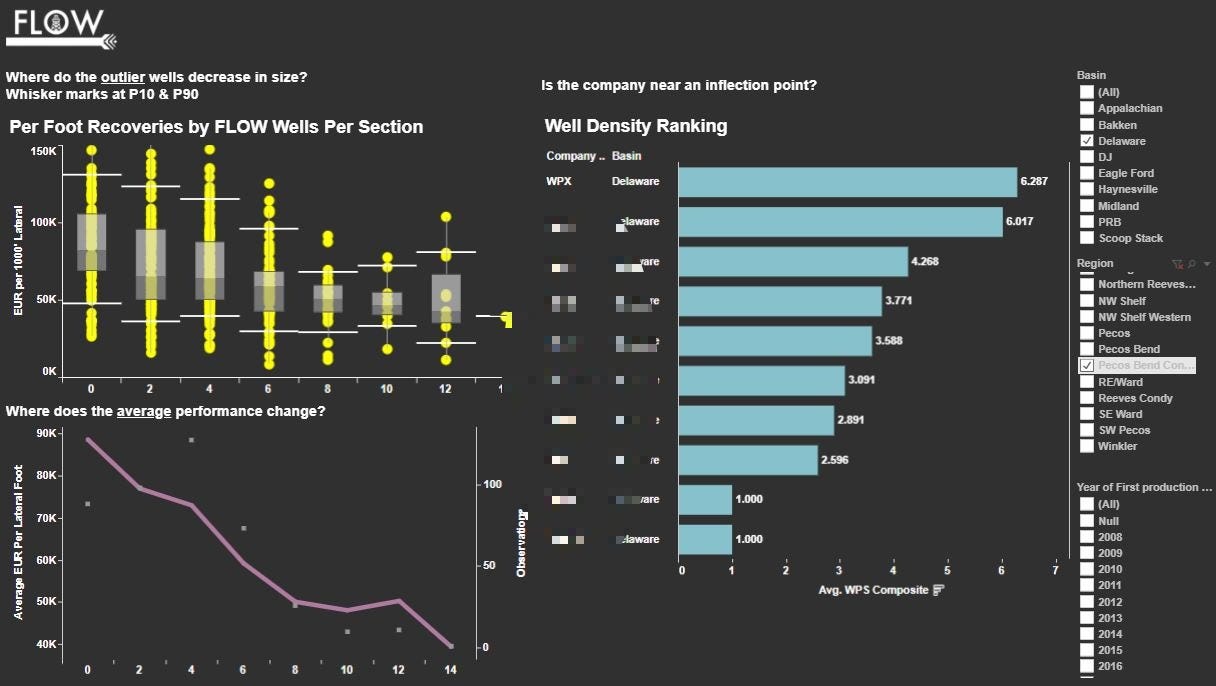
1) Identify WPX’s Stateline Density and assess the density at which large outliers disappear or mean well performance drops.
We see 1-4 Wells Per Section groups have large outliers and large mean recoveries. Beyond 6 WPS, these measures decrease substantially.
This allows us to create a density bucket for early-development wells (1-4 WPS) and a density bucket for full-field development wells (6+ WPS). We will use the full field for WPX because their density exceeds the full-field minimum.
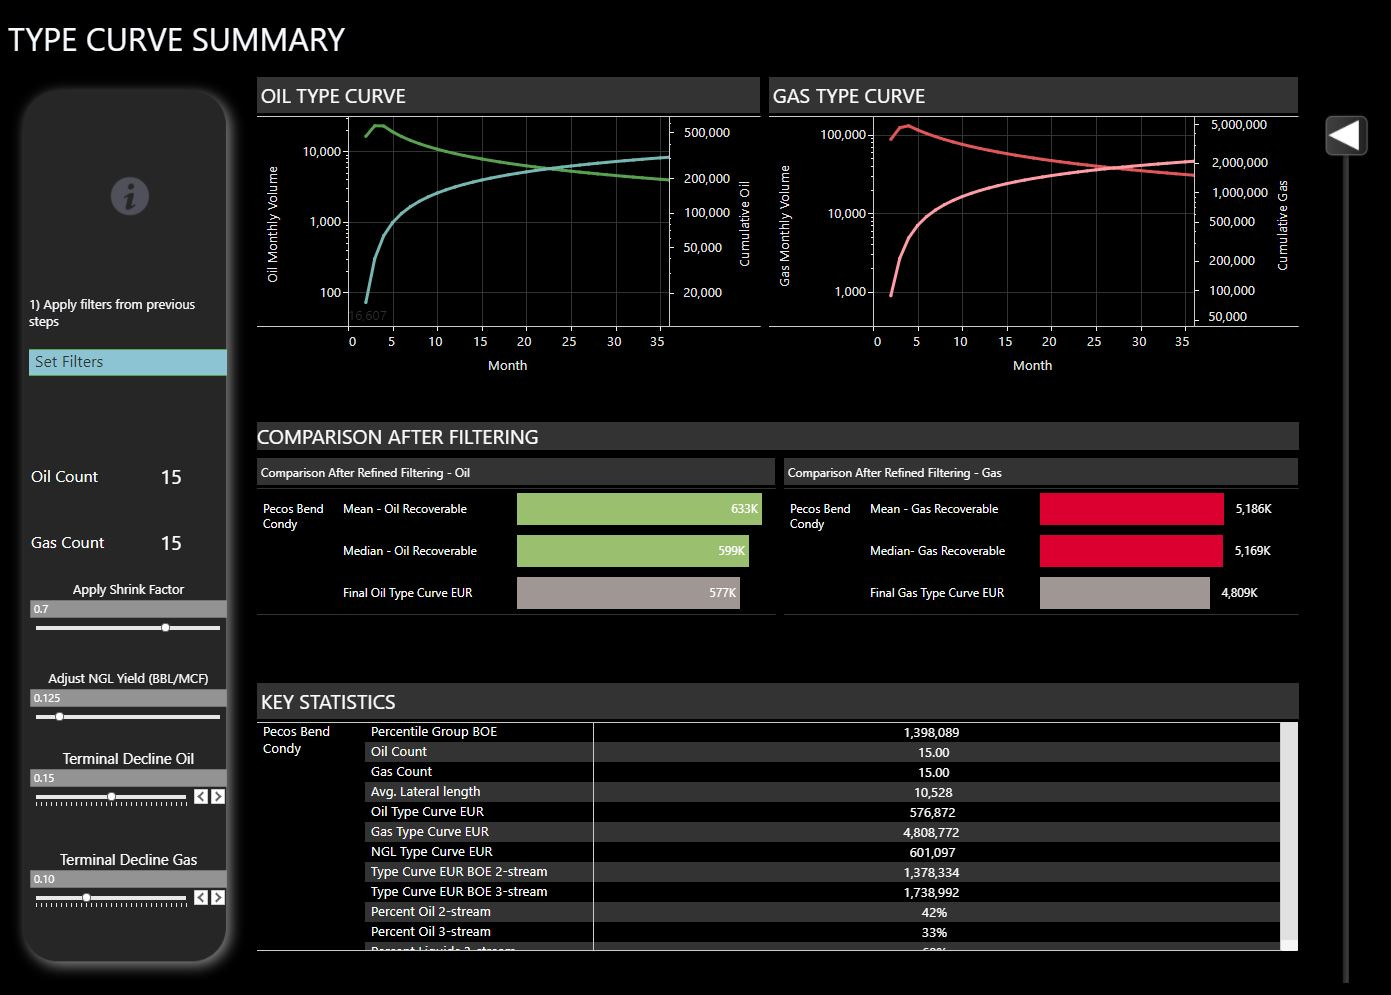
2) Use our Type Curve Explorer to create a type curve filtered for more than 6 Wells Per Section. This takes about 2 minutes. We get a 577 MBO type curve with only a 33% 3-stream oil cut.
In our prior WPX Stateline analysis we were looking for a target 644 MBO curve with a 37% oil cut to match the company’s guidance. We arrived at a WPX-specific long lateral 585 MBO result – essentially because WPX’s long laterals are densely spaced.
So now we can isolate the full-field expectation before the company disappoints us. We also can explain why WPX’s wells will not scale up the way they have stated.
3) For comparison, we construct a type curve for the early-development wells. This only takes about 2 minutes, so it is easy to add context that will help us underwrite our positions.
Not surprisingly, we get a stronger low-density type curve which forecasts 802 MBO. Also, the oil cut is stronger. (As density and interference increase, we observe oil cuts trending toward the gassiest formation.)
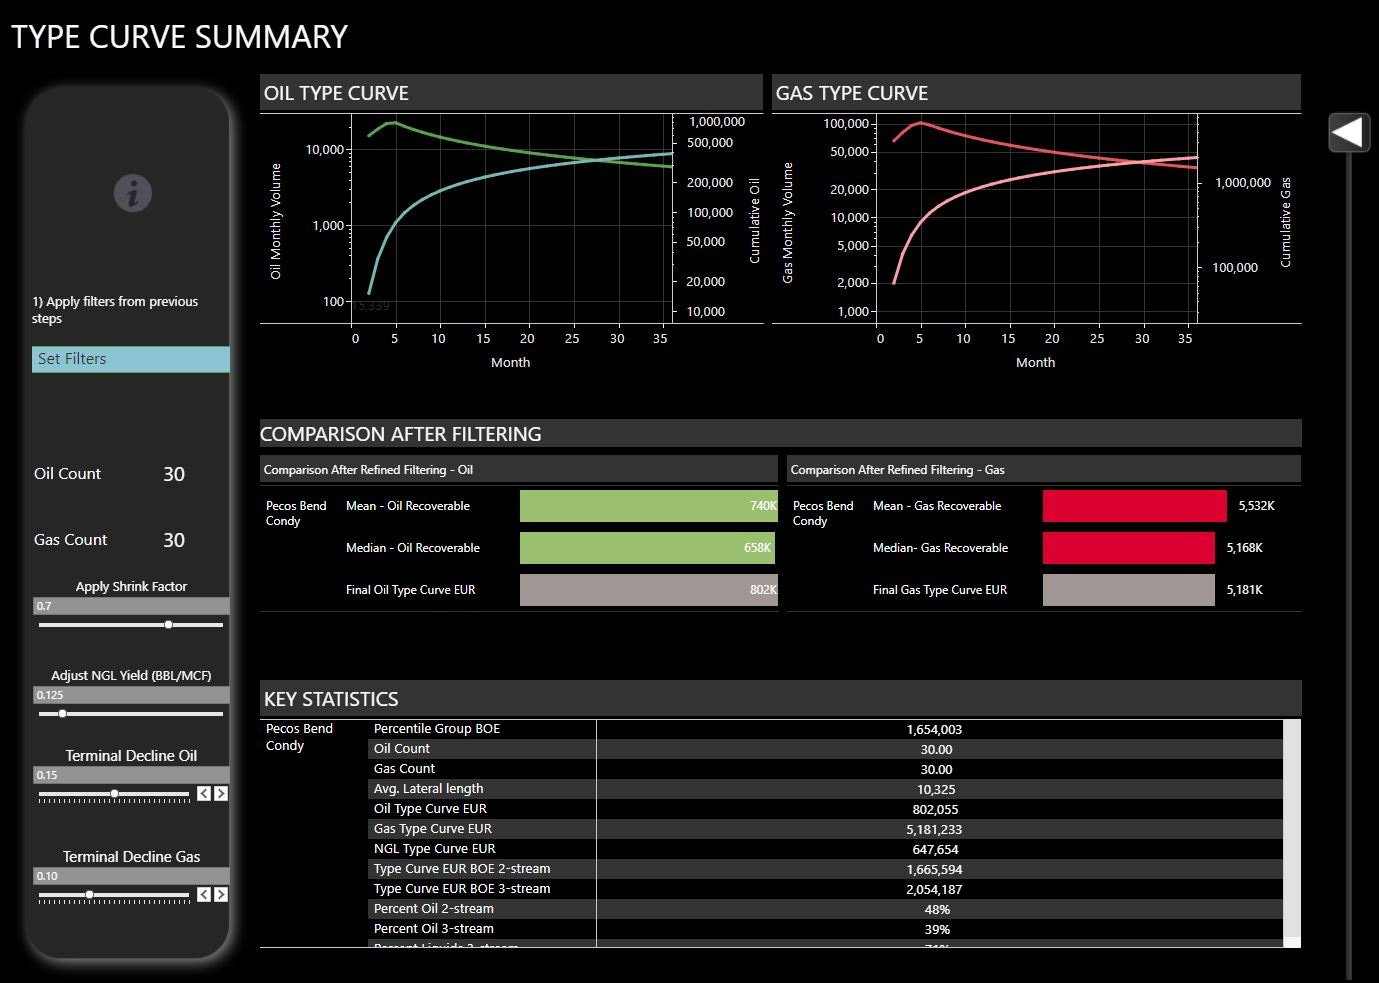
We have applied outlier filtering to both curves as a part of our user-defined process. In doing so, we dampened the effect of the huge wells on the low-density type curve. This is an appropriate action in getting to a “typical” well, but it will also start our comparison from a lower EUR than most methods would create. So if you were looking more than a 30% step down in oil recovery, keep in mind both of our estimates are built for accuracy through outlier control!
You can subscribe, but if our products will help you get better investment results, don’t hesitate to contact us through our website or social media.
www.flowoilwell.com